Doing Qualitative Research: Write and report
Writing and reporting
This page focuses on writing in the process of analysis, and reaching conclusions. Of course you will need to write-up your findings, probably in the form of a dissertation, thesis or research paper of some sort, so we cover some of those aspects too.
Types of writing in research
Purpose of writing in research
- Research/test
- Thinking
- Reporting
- Achieving
- Persuading
- For structure
- For creativity
- Engagement
Written research
outputs
- Research diary
- Field notes, interview summaries
- Write up as a narrative
- Report (thesis sections, papers, business reports or briefings, blogs, articles, models)
- Memos
- Observations
- Methodological
- Theoretical
- Personal
Literature often focuses on the ‘writing up’ and reporting of research, as compared with writing to interrogate the data. For example, you might find lots of advice on creating headings for structured reporting but much less on making helpful notes-to-self for creative discovery. In the table above you can see that reporting is only one function of writing in research,[1, 2] and a thesis is only one type of written output. You will use writing in order to think about your data, as well as to report your findings. Writing frames the whole research process: you only have to think of everything that needs to be written during the planning or data gathering phases before we even get to the analysis (e.g. interview schedule, observation templates, and field notes). Writing is a continuous and iterative process throughout analysis too.
Writing in analysis
Language about writing in Qualitative Research
Research Diary
- Reflexive diary
- Records of supervision
- Records of meetings or minutes
- Scattered thoughts and reflections
Memos
- Marginal notes
- Post-Its
- Annotations
- Markers in text
Quirkos
- Memos
- Chat
- Blank sources
- Imported sources
- Reports and models
Any writing that you use to help you think about your data and what it means is analytical writing. Analytical writing tends to fall into a couple of categories:
- Writing which occurs as a result of direct and concurrent contact with the data. These are labelled here as Memos
- Writing which occurs when thinking about the data, your meta-data, emerging analytical patterns, integration with what is already known i.e. the literature. This kind of analytical writing is labelled here as Research Diary
All good analysis stems from time spent with the data. The tools you use should facilitate this, not detract from it. It is worth remembering that all of these tools and labels are used with one aim in mind; to help you think about your data and relate it to the conclusions that you draw.
Reflexive writing
You have already come across the idea of being reflexive in qualitative research. You might have created some of your own reflexive notes during this curated course. One of the key ways of capturing your reflexive thoughts and subjective positioning relative to the data is to keep a research journal, or diary. Yes, you can include factual and objective information if you like, but its purpose is mostly for you to gather your subjective thoughts and feelings. We do this in order to understand what is affecting our decision making and thought processes; to acknowledge our subjectivities, and distance ourselves or embrace them, as appropriate for our research.
If you need a reminder of what reflexivity is, read point 6 of this blog before moving on to the detail of reflexive journals:


Quirkos Cloud offers simultaneous collaborative working and a chat function that allows you to communicate securely (and keep a record) with collaborators within Quirkos.

It might seem a little odd to talk about reading, however whatever we write, we really should read. It’s another way of gaining or maintaining perspective on our analysis and being reflexive.

Memos and notes
Using memos in CAQDAS is analogous to writing in the margins of a page, annotating between the lines on a page, or using a sticky-note to make some notes next to the information that prompted your thinking.
Some people do not ‘code’ as such. They merely read, read, write, write, memo, and reflect and write some more. I say ‘merely’, but this is a misnomer. It is intense work.

You have been given suggestions about using and classifying memos.
Use your notebook to reflect on how you use memos.
- What is helpful about how you currently use them?
- What could you do differently to improve your management or analysis?
Tabulated writing — The matrix
Matrices (or tables and spreadsheets) remain a common point of reference in qualitative data analysis. We are often trained to organise data in this way. However it can also be a tool for generating and recording analytical thinking and drawing conclusions.
The 3 column format is found in economics, business, law, and advice to students on note-taking; even civil-service analysts use it to record and demonstrate the link between evidence and conclusions. I find it a great starting point for thinking about my first pass of the data before moving to a narrative style of analysis.
The Matrix
| Fact | Comment | Assessment |
|---|---|---|
| Data | Your label (code/quirk or memo) and description | So what? How does this relate to what is known/theorised upon/unknown |
Whatever you call your headings, you can see that they equate to:
- (Fact) raw data or quotes
- (Comment) your codes/labels/tags
- (Assessment) your thinking/assessment
After your first pass of the data (or even before you’ve finished the first pass) you will continue your thinking and writing to build on what you have. You could add to your matrix, or you could use narrative in your reflexive notebook before creating new codes/labels for your data.
| Fact | Comment | Assessment | New hypothesis/emerging pattern |
|---|---|---|---|
| Data | Your label (code/quirk or memo) and description | So what? How does this relate to what is known/theorised |
New code, group or cohesive theme or superordinate construct emerging from your assessment |
Quirkos will link your comment to your data and make it easy to retrieve, however, you must do the thinking. But remember, the vital caveat from 💻 Manage and handle data, CAQDAS will not do your analysis for you.
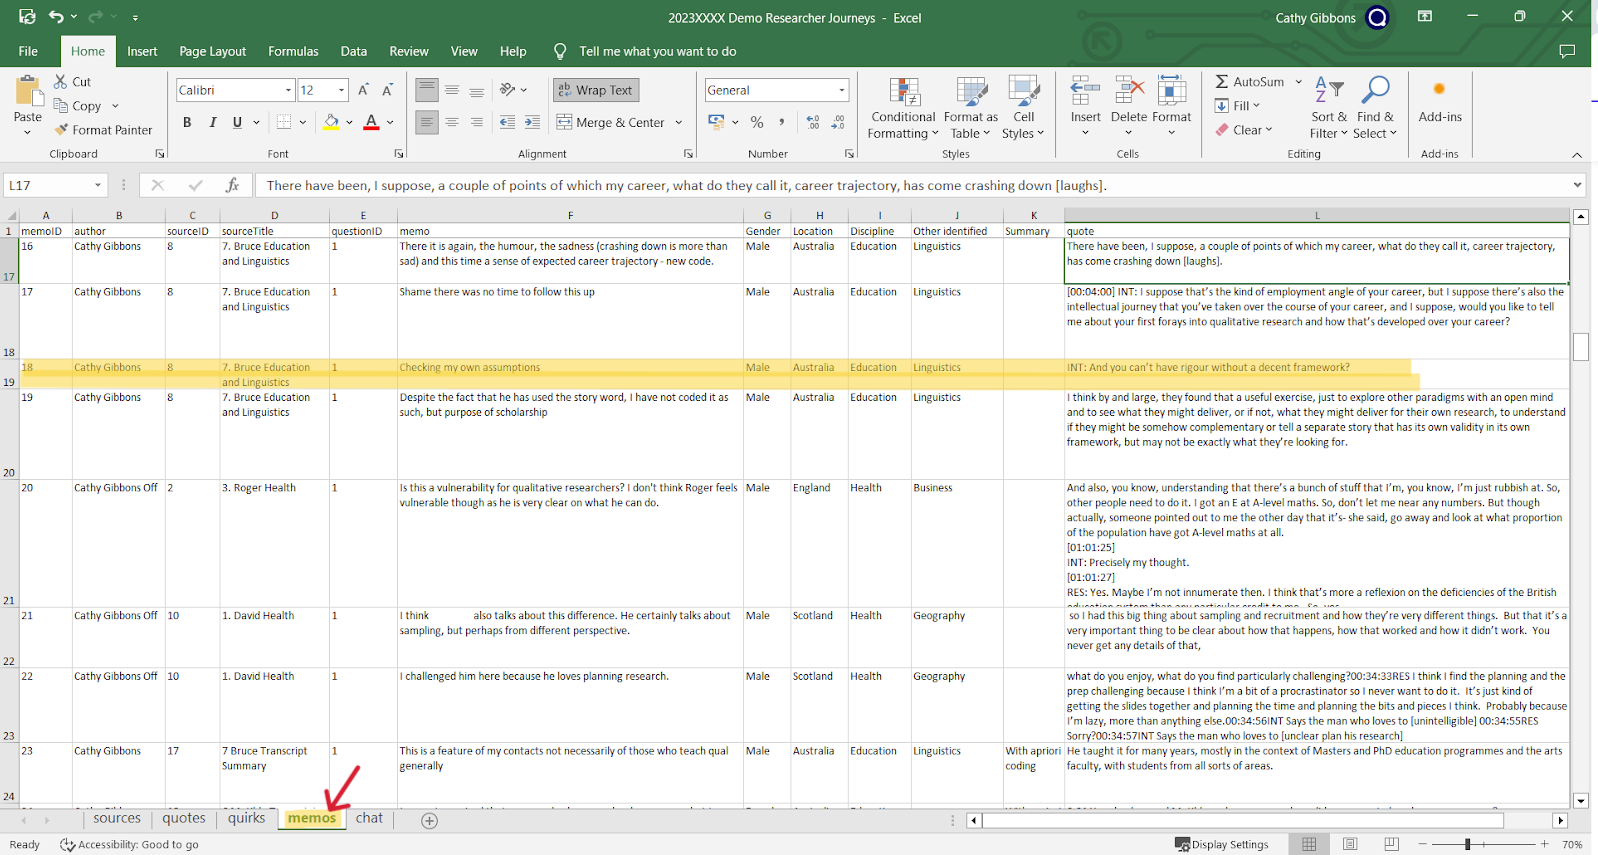
Quirkos uses a matrix (table) view of the data in its spreadsheet export. You can filter the columns to view your codes, the associated data, and then add a column to add your notes.
In addition to the Spreadsheets exported from Quirkos showing coded data, they also show tabs of the quirks (codes), memos and any collaborative chat. It is easy to view, edit and maintain your code book in a spreadsheet format, if you need to. I especially like it for viewing and filtering my memos.
Where should I put the assessment? And what should I do next?
In paper formats, you would literally cut and move around your pieces of data, or create tables and paste or write the data in, or even use a spreadsheet. In Quirkos you have a number of choices — Your thinking needs to be recorded somewhere, and linked to the codes and the data to which it relates.
- Using memos is a possibility, as the memo is linked to the data. You can make these easy to retrieve by linking them all to additional Quirks and call it ‘memo’, or use the categories that Gibbs[2] suggests, such as Observations, Analytical, Method, Personal.
- You could annotate directly into your source data, alongside the relevant data — a bit like writing on to your text or in the margins. Again you could add a Quirk to put all your annotations in. When you open the Quirk, all your annotations will be shown. This method also means that you can use simple text searches within sources to find and retrieve your annotations. Caution: Use a method such as italics or underline to differentiate your notes in the sources from the source text. (I don’t trust myself to remember to do this, so I always use memo functions, but you don’t have to).
- You can then move beyond the first pass, and work on merging, grouping and developing new ways of looking at your data with new coding or coding groups.
- You could be more ‘old school’, and export your coding/memos (i.e. the first 2 columns, plus lots of other meta-data, like date-time stamps) and fill in your assessment columns remotely. It is ok to mix hard and soft methods like this in Qualitative Research. You can return to your data with your new categories and themes, either starting with a ‘clean copy’ of the data, or continuing with your already labelled data-set, shaping the data into your new categories and themes.
Of course, this process is not limited to 3 or 4 steps, nor are you bound to particular steps or labels unless you espouse (or claim to espouse) a particular approach. Your disciplinary background and theories that you are steeped in (whether you realise it or not) will affect your thinking and how you structure and report on your data.
3 column format
When it comes to writing-up your analysis, the 3 column format can be helpful too.
When reporting, you’re likely to present your new thesis, argument or hypothesis backed up by your evidence/data and then relate it to the implications of your findings for practice/policy/theory, with any rebuttals accounted for. So let’s think about reporting and writing with Quirkos.
| New hypothesis/emerging theory | Evidence | Implications |
|---|---|---|
| New code, group or cohesive theme or superordinate construct | Data extracts, vignettes, quotes | Linked to what was previously known |
Once again, whatever you call your headings, you can see that they equate to:
- (Emerging theory) Description of your new code, group or theme
- (Evidence) The data you are using to build an argument
- (Implications) An explanation of why this is important, new, or makes a difference to what is already know or done in practice
Reporting — Writing to communicate
Writing up qualitative research
What you include in a thesis, blog or academic paper will be determined by:
- Your purpose in communicating
- The needs and purpose of your audience in reading

Writing the literature review


What kind of writer are you?
Consider your preferences for producing writing. Where, when, how much? What helps? What hinders you? Discuss with a colleague.
Different things work for different people; however different things work for different types of writing. So, you will need to adapt new methods as you develop.
Create a mindset that gives new methods a fair trial.
Advice
“Whatever combination of steps and strategies works for you is right as long as ideas are put to paper. Given time, they can be transformed into a more coherent and polished statement.”
Harry F. Wolcott (2001), p27[3]
Gibbs[2] adds:
Write early and write often. Don’t get it right, get it written!”
Automated reports
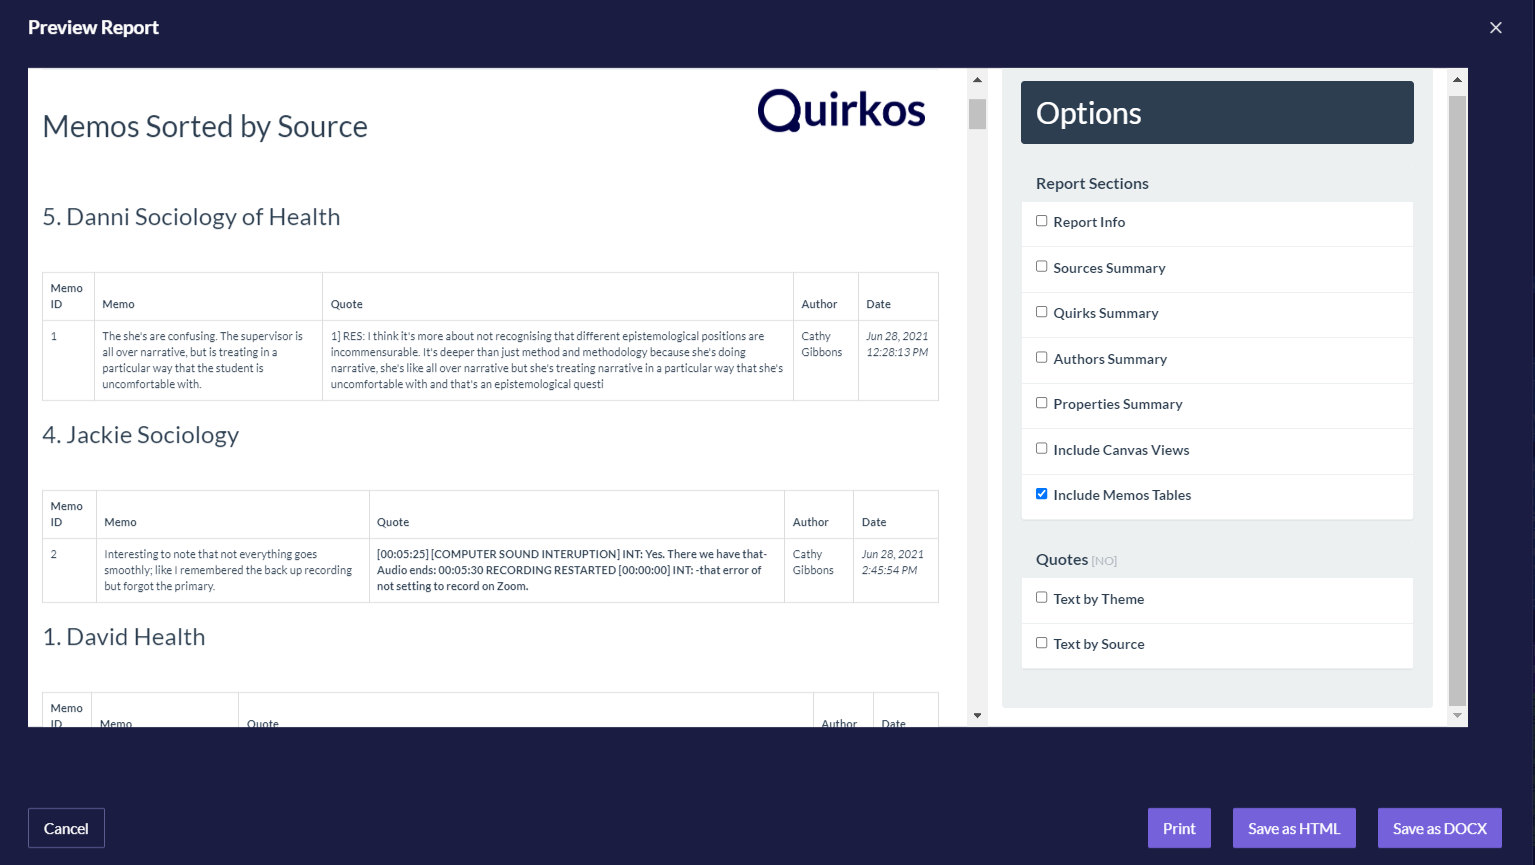
An important thing to make clear is that many CAQDAS, including Quirkos, have a reporting function. It is tempting to see this as a button that will write a research report for you; it will not. (Look out for future blogs on the threats and opportunities posed by chatbots and automated writing tools). Report tools in CAQDAS generate reports on the coding, memos and notes, and any models. They are a useful alternative to viewing your project in the software to help you think. They are useful in extracting parts to include in reports to others, or when sharing with those who have no access to any CAQDAS.
The Quirkos report includes the description and detail of all the codes (a very handy function that acts as your ‘code book’, see 💻 Manage and handle data), the actual source text that has been coded, and any memos that have been written.
You may not need to see a report in this format for you to be able to choose what you want to copy and paste into a piece of writing for others to read. However, others find this table format less distracting when thinking about writing for communication to others.
Writing and communication tools in Quirkos
Quirkos doesn’t create lots of specific tools for specific purposes i.e. press this button to create your research diary, press here to create a memo on methodology, press there to ‘memo’ a clarification of language. It has fewer tools than other CAQDAS but greater flexibility in how you use them. Quirkos keeps it simple – one word for each thing but they can be managed how you wish.
Sources are the things that you import, the rest are the functions you apply within Quirkos.
Specific writing tools for analytical notes or annotations can be made using Chat (which is exportable as a CSV, but not codable), and Memos, which can be linked to coded data.
Gibbs and others strongly recommend that you don’t put all your memos under the same label e.g. ‘Memo’. They urge you to consider the function or purpose of the memo and label it according to its purpose. E.g. Observations, Methodological, Theoretical and Personal. I’d advise against having too many different types of memo if you are using them as a rapid, in-the-moment way to capture your thoughts. If you end up with lots of different types of memos, it might be argued that you are using your memos as labels for the data, otherwise known as a code. That’s perfectly ok, but it makes searching and retrieving how you have labelled your data both laborious and time-consuming. CAQDAS, including Quirkos are designed specifically to quickly search and retrieve coded data, not memos.
You can if you prefer, edit the document/source text itself to ‘annotate’ your documents. Personally I avoid interfering with source texts, for fear of confusing my annotation with the source text. If you do make annotations in the text, you must be very careful to label them as such (you could use a quirk, italics or text colour).
You can also use the Word Cloud and Report functions to help you think. These are not necessarily meant for you to give to other people. Indeed for anyone outside your team they may not make much sense on their own. However, they are a helpful starting point in thinking about the structure of your data and any themes that seem to be emerging in the codes, and to create a briefing note for others who are interested in the progress of your thinking. Sorry, you can’t hand it in as a dissertation, but you may be able to extract parts, such as quotes, and code relationships, directly into parts of your dissertation.
Where next?
You’ve come to the end of this curated course. We hope you have enjoyed it. Remember you can go anywhere you like in this course, using the model at the top. You can re-visit as often as you like.
If you'd like to make your next qualitative project easier, why not give Quirkos a try? Register for a free 14-day trial and see for yourself how it can make your qualitative analysis more engaging, fun, and efficient.
Register for your free Quirkos trial today!Tell us what you think!
We'd love to hear from you so we can make this course as useful as possible. If you'd like to leave feedback, suggestions or comments, please use the button below.
Fill out our surveyTry today!
Ready to give Quirkos a try? Register for a free 14-day trial of Quirkos today,
with no restrictions on features or
projects.with no restrictions on features or
projects.
Want to learn more? Read more about our features or see Quirkos in action!