Doing Qualitative Research: Analyse and transform data
Analyse and transform qualitative data
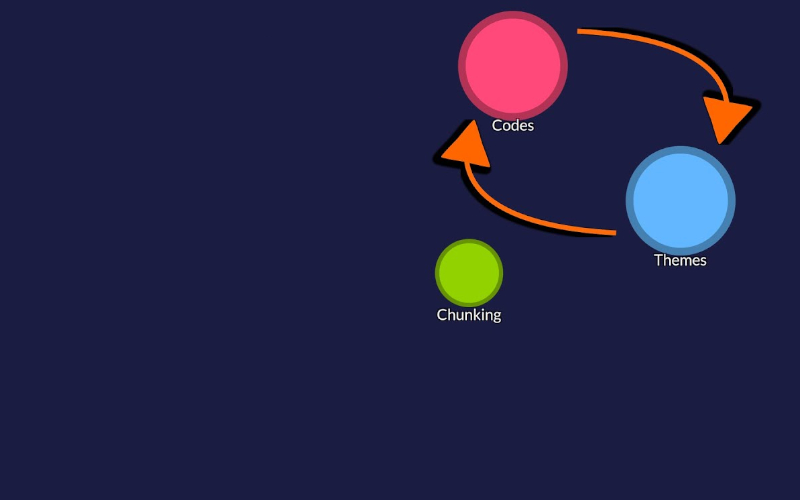
Welcome to our page on the transformation and analysis of qualitative data. As our model suggests you can take this curated course in any order you like. You may have come to this page with little or no previous knowledge of analysis in research, be vastly experienced in numerical forms of analysis, or be in between. For that reason this page gives you lots of optional material, some of which is quite basic all the way through to some really specialist approaches within qualitative research. The emphasis in this part of the course is on how to analyse data qualitatively. Use the chart below for some guidance before you get going on this page.
Super-quick start
We understand sometimes circumstances are not ideal and you just need to do some ‘quick and dirty’ analysis. This blog and videos will get you through. Just remember to come back to the detail of this page later to understand how to do a better job in future.


Simply labelling your data with codes or themes or tags is merely a descriptive task to help you think. Analysis is taking the patterns and groupings in the codes/themes/tags and forming a deeper understanding, conclusion or recommendation. The blog and the video explain more:

Good luck and come back soon!
Data Analysis Methodology
As we discussed in 💭 Epistemology and Meta issues, your methodology will frame everything you do. (For our purposes we will treat methodology and epistemology as the same thing). Without a methodological framework you are applying blunt tools to your problem exploration. So you need to ask yourself some questions to keep your analysis coherent and robust i.e. fit for purpose.
Some key questions
- How will you analyse your data?
- When will you analyse your data?
- What are the underpinning theories of your research?
- Does your analysis reflect these theories?
- What is your purpose?
Ask yourself the above questions about your analysis.
Perhaps you answered these questions as part of 💭 Epistemology and Meta issues; if so, go back and check if anything has changed.
If not, have a think and answer them now.
What is coding, and why do we do it?
Coding is the process of labelling and organising to identify patterns or themes in data, in order to understand the relationship between them or create new understanding (e.g. generate new hypotheses, critique existing theory, suggest practical applications and problem solving frameworks), or make predictions about trends, patterns of behaviour or events.
Remember, simply labelling your data with codes or themes or tags is merely a descriptive task to help you think. Analysis is taking the patterns and groupings in the codes/themes/tags and forming a deeper understanding, assessment, conclusion or recommendation.
Coding is not something you must do. It is merely a way of labelling your data so that you can see patterns more easily. It also helps in the process of finding sections of data that you have identified as interesting. Some people never actually create labelled codes in their data. Their detailed knowledge of the data along with copious notes allows them to think critically about formulating a coherent analysis, without short-form labels to help them. But coding helps you to visualise patterns and cross-reference codes, and if you are using software, you can achieve this really quickly.
Coding and analysis approaches vary but what they have in common is that they are systematic, iterative and purposeful. To be truly philosophically qualitative, they are also reflexive. This is how Braun and Clarke[1] distinguish their form of Thematic Analysis from long existing general models of thematic analysis, such as how we at Quirkos describe thematic analysis generally. Qualitative research is an iterative process, so both of these examples loop backwards and forwards in the process.


Language in qualitative coding and analysis
You may come from a background where you are trying to confirm a hypothesis, or you will base your analysis on what is already known about a subject e.g. from the literature or personal subjective experience. This can form the explicit frame-work for your thinking about and applying to your data. Sometimes referred to as frame-work analysis, your codes and labels are pre-determined, and you will look for examples in your data. Qualitative methodology however, tends towards data-led coding, and you may even use it exclusively in some approaches e.g. Phenomenology, Grounded Theory. This means that you will not have pre-determined labels. You will examine the data for themes, concepts and patterns; you may even use the exact words or phrases from your data (in-vivo* or ‘live’). Your codes and labels will grow in number as they ‘emerge’ from the data.
Many qualitative researchers, especially students, will start with at least some theory with which to generate questions in the first instance, before focussing on the data. So there will be a mix of pre-existing and emerging codes. You will see many terms in the literature to describe these contrasting approaches. Please be aware that I have over-simplified the topic by presenting the terms in contrasting pairs, but it should help you when reading more complex texts.
Langauge in coding and analysis
Pre-determined codes
- A priori/priori
- Deductive
- Etic
- Theory-led
- Applied to the data
- Objective
- Index
- Top-down
Data-led coding
- Emergent
- Inductive
- Emic
- Experiential
- Emerging from the data
- Subjective
- In vivo
- Bottom up
These blogs should also help you to grasp the concepts so that you can understand the subtleties of concept or theory-led coding compared to data-led coding for when you read in greater depth in your areas of study.


The mechanics of coding
Getting started identifying relevant and representative pieces of text to label can be very challenging, especially when demands to be analytical rather than descriptive are ringing in your ears. Careful reading of the text is your starting point. You may have some pre-determined labels/codes/themes/tags that you can spot and apply to your data, and then as you read you will notice things emerging from the data that you will want to name. On paper you would probably underline or highlight things, and maybe write a note in the margin. It can all seem a bit descriptive and disjointed at this ‘first-pass’ stage, but we’ll get to the more analytical stuff later. Let’s keep looking at coding for now.
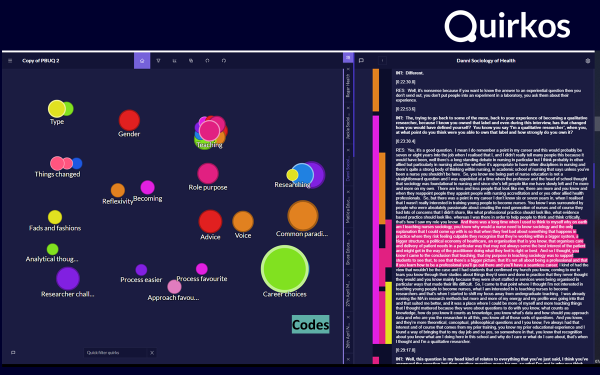
This snapshot shows how I used Quirkos to code one of our projects, Qualitative Researcher Journeys. You can see all the codes used in the project on the left. On the right you can see where a chosen code is used in the text (just like you might highlight or underline text on a page). And in between the two you can see the coding stripes that show the other coding in that text.
What kinds of things will you code?
As well as general themes in coding (e.g. Analytic, Descriptive, Categories) Gibbs[2] gives a list of what to code. It’s not exhaustive of course and gives you an idea of just how wide ranging coding can be: click on each item to learn more.
What can be coded?
Specific acts, behaviours — what people do or say.Examples: Avoiding the question. Getting the opinions of friends.
Events — these are usually brief, one-off events or things someone has done. It is not uncommon for the respondent to tell them as a story.Being rejected at job interview. Moving into a homeless hostel. Finding husband has another woman. Joining a sports club.
Activities — these are of longer duration than acts and often take place in a particular setting and may have several people involved.Going dancing. Taking a training course. Helping partner with dementia get washed and dressed. Working in a bar.
Strategies, practices or tactics — activities aimed towards some goal.Using word of mouth to find jobs. Getting divorced for financial reasons. Entering a relationship to get somewhere to live.
States — general conditions experienced by people or found in organizations.Resignation, e.g. ‘At my age it's hard to find work.’ Working extra hours to get the job done.
Meanings — a wide range of phenomena at the core of much qualitative analysis. Meanings and interpretations are important parts of what directs participants' actions.- What concepts do participants use to understand their world? What norms, values, rules and mores guide their actions?
The idea of ‘on-sight climbing’ amongst rock climbers to describe doing a climb without inspection, artificial aids, pre-placed protection or previous practice, with the implication that this is a superior way of doing a climb. - What meaning or significance does it have for participants, how do they construe events, what are their feelings?
Blame, e.g. ‘His letter made me feel I was to blame’ - What symbols do people use to understand their situation? What names do they use for objects, events, persons, roles, settings and equipment?
Delivery van referred to as ‘the old bus’ (affectionately or dismissively). Teaching referred to as ‘work at the chalkface’ (like work at the coalface, not administration).
Adjusting to a new job, e.g. ‘I find I have to be careful what I say now, because I know about things before they are finalized’.
Relationships or interaction — between people, considered simultaneously.Enjoying the family, e.g. ‘... they're 26 and 21 and most boys of that age are married, but mine aren't and they like to come home, have friends stay. I like that.’
Conditions or constraints — the precursor to or cause of events or actions, things that restrict behaviour or actions.Firm's loss of markets (before lay-offs). Divorce (before financial difficulties).
Consequences — What happens if…Experience gets jobs, e.g. ‘So what you get is, people that haven't got no qualification, but have got a few months' experience are walking into jobs.’
Settings — the entire context of the events under study.Hostel for the homeless. Training college. Day care centre.
Reflexive — the researcher's role in the process, how intervention generated the data.Expressing sympathy, e.g. ‘It must be hard for you in that situation.’
Beyond the first pass — ways to think about analysis
First-pass coding consists largely of isolated codes that are not necessarily linked in any way to other codes. As you continue you will notice you are seeing more overlapping codes in the data, and you'll start to ask questions of your data. ‘I wonder if/what else…’. This means you’ll go back to reading your data again, and again, and again. You may start to group your data differently, delete codes, merge codes, make new connections between what your data says and what is already known or unknown about a topic; in short you will become more analytical.
Typical tools for thinking about and transforming data
Transcript
- Codes in data
- Memos or marginal notes
Research journal
- Reflexive writing about the research before you write for an audience
Visualising the coding of the data
- Models
- Sociograms
- Post-its
- Mind-maps
Tools to help you see and think about the data
- Look at the occurrence of coding within sources and across sources
- Look at over-lapping coding and coding stripes – think about why and where they overlap. Is it a function of how you have coded things, or is there some close relationship in elements of the data that may be meaningful? (Remember, if you haven’t coded or labelled data, then it will not appear in any of your searches).
- Are you coding similar things by different names (resulting in too many descriptive codes)?
- Are you coding things by the same names when there are differences that could be important (rushing to create themes or groups, perhaps)?
- Examine memos and notes
- Look at automated reports for patterns
Some of the tactics used by Miles and Huberman:[3]
- Note patterns and themes (within case, cross-case) deductive or inductive
- Make contrasts and comparisons
- Attempt to replicate a finding
- Find exceptions
- Make conceptual or theoretical coherence
- Build a logical chain of evidence
- Check for negative evidence or alternative explanations
- Following up surprises
- Participants feedback or involvement
- Making metaphors
- Clustering
- Identify dependent and independent variables
- Counting
- Partitioning variables
It should be evident from all of these tactics that it is necessary to spend time with your data, and that no automated service can think for you. However systematic management of your data, whether you use software or not, improves the rigour of your analysis, and reduces the chances of missing something.
Seeing analysis in action
Making the leap from coding to analysis


More language in coding and analysis
First Pass
Forcing data
Line by line
Open coding
Categorisation
Data saturation
Axial coding
Developing themes
Examining patterns and relationships between codes
You will come across many terms to describe coding and analysis. Some approaches will use terms in quite prescriptive ways, while others will use the same term quite generally. (We’ve already seen how Braun and Clarke are specific about Thematic Analysis. Other examples include Open Coding in Grounded Theory and Line by Line, in Interpretative Phenomenological Analysis (IPA).
Create a glossary for the terms you will be using.
Identify where you are using a general term, and what you mean by that term. Identify where you are using specific terms as defined in a specific methodology, such as IPA, and add citations. This will help you to be consistent practically with your method and with your methodology.
Reaching conclusions
It is worth remembering that all of these methods are used with a specific aim in mind: to help you think about your data and relate it to the conclusions that you draw. Some people do not ‘code’ as such. They merely read, read, write, write, memo, and reflect and write some more. I say ‘merely’, but this is a misnomer. It is intense and extensive work. All good analysis stems from time spent with the data. The tools you use should facilitate this, not detract from it.
Where next?
It is almost certain that your analysis will need to take a written form even before you reach a discussion or conclusion to present to others. In the next section ✒️ Write and report, we’ll cover writing for analysis.
Optional materials and resources
In-Vivo coding
Collaborative analysis
Different Qualitative Approaches
Using Quirkos
Data management plans
Go back to the Data Management section of the 💭 Epistemology and Meta issues page if you need a reminder of the requirements for a Data Management Plan. The most generally relevant guide for qualitative research (in the UK) is probably ESRC’s policy on research data planning.
Using emoji in analysis
Tell us what you think!
We'd love to hear from you so we can make this course as useful as possible. If you'd like to leave feedback, suggestions or comments, please use the button below.
Fill out our surveyCitations
[1] Braun and Clarke (undated). Doing Reflexive TA.
[2] Gibbs G. (2007), adapted from Strauss (1987), Bogdan and Biklen (1992), Mason (1996) in Analyzing qualitative data. Sage Publications Ltd. P47, Table 4.1 P47-8.
[3] Miles, M.B., Huberman, A.M. and Saldana, J. (2014) Qualitative Data Analysis: A Methods Sourcebook. Sage, London.
Try today!
Ready to give Quirkos a try? Register for a free 14-day trial of Quirkos today,
with no restrictions on features or
projects.with no restrictions on features or
projects.
Want to learn more? Read more about our features or see Quirkos in action!