Quirkos Desktop - Step-by-step guide
Accessing Quirkos Desktop
For help with downloading and installing Quirkos, click here.
Once you have Quirkos installed, start by double clicking on the icon in your Start menu or Desktop in Windows, the Applications folder or Dock in MacOS, or for Linux by using the icon or typing 'quirkos' in the terminal.
7 easy steps
Qualitative analysis in Quirkos Desktop can be broken down into seven sequential steps:
1. Creating a project
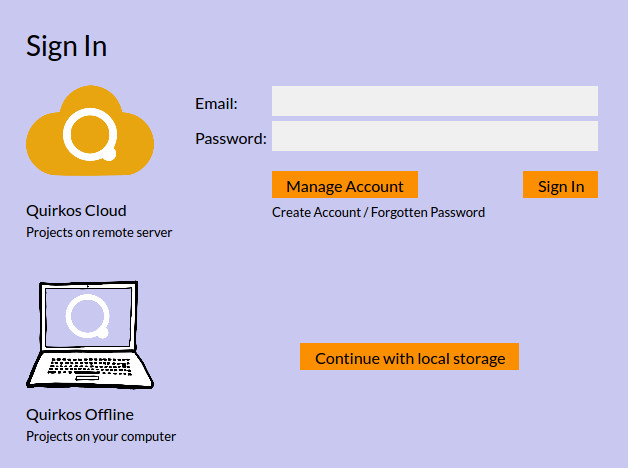
Quirkos lets you work with data stored in our server with a cloud subscription, or stored locally on your own computer with the static licence. Either login to your cloud account and create a new project in the cloud, or choose 'Continue with local storage' to create a project saved on your computer. If you want to use Quirkos Cloud to have access wherever you login, you will need to create an account associated to your email and with a password, and credit/debit card.
Quirkos stores all your work in a project file, and this must be created before you can import your qualitative text data. This is a small file that is easy to backup, e-mail and share with others. If using local storage, we recommend that you work on the file on your local computer, not directly from a network connection or backup service, for the best performance and reliability. Quirkos automatically saves your work as you go, so there is no need to press save. Just close the programme at any time, and your work will have been already saved. The cloud storage lets you access your data from any computer where you install Quirkos and login to your account.
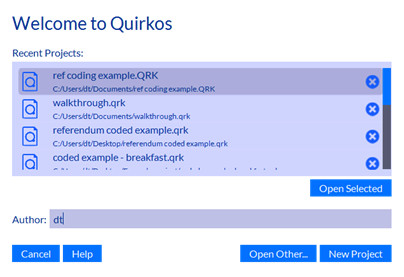
Quirkos starts by displaying a list of your recently used projects, and you can create a new project by clicking on the 'New Project' button on the bottom right. You will get options to password protect the project, or set up a structured question project for importing survey data. There is also space to record your name or initials, so that in collaborative projects you will be able to see who has made changes and additions. Click New Project again, choose a file name (and location if working offline) for your project and then Save to create the new project.
2. Import your data
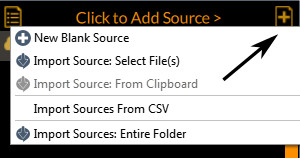
Quirkos only works with text data and you can import files directly from Word files (.docx), Text (.txt), Rich Text (.rtf) and Portable Document Format (.pdf). These are the most common formats you will encounter, but it's also possible to bring in spreadsheet data if you saved in a Comma Separated Values (.csv) file, which is the default export format for many online survey platforms.
It's also possible to use the copy and paste functions on your computer to create a new source in Quirkos. This is useful to bring in data from a webpage (like a blog article, or social media stream) or even if you just want a small part of larger documents. Finally, you can create a blank source that you can write directly into. This works well for recording ongoing memos, and copying and pasting from multiple sources.
All these options are available by clicking on the (+) Add Source button on the top right of the screen. All your sources can be edited at any time by right clicking on the text.
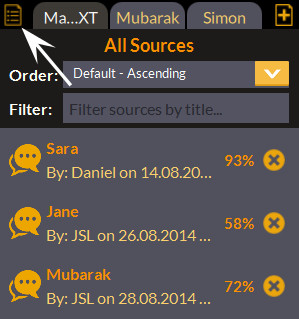
You will see your text sources shown as a column on the right side of the screen. At the top are tabs which can be used to display the last three sources used. At the left of these is the Source Browser button which shows a list of all the sources in the project, and how much coding has been done on them. Clicking on a source here will load it in the text view column.
3. Describe your sources
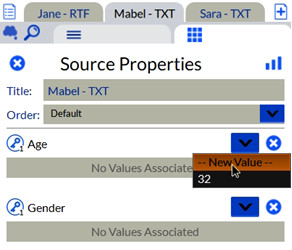
Quirkos lets you define any number of properties for your sources, to describe things like gender, age, name, location or any other information on the source. Just click on the properties tab to change to the Source Properties view for the current source. A category like 'Age' is a property, and an answer like '42' is the value for that source. You can use these properties later to explore your data, so that you could see all the results from, for example, men or people between a certain age range.
Click on the (+) button at the bottom of this screen to quickly add a new property and value, or use the Property editor to create multiple new properties and values, or to edit existing ones. This is also how you would create and store discrete response questions in a questionnaire.
4. Create your themes
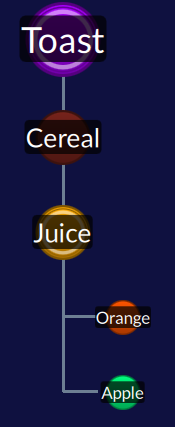
What topics do you want to pick out from your data? In Quirkos these themes or 'nodes' are represented by coloured bubbles which grow each time you add some text to them. They are used to group sections of the text on a particular topic, such as Family, Voting, or Disagreements. You can create a new topic category by clicking on the (+) button on the top right of the canvas view area on the right of the screen. A new bubble is created with a random colour and location, and a dialogue pops up to let you change the name, description and colour of the bubble. Right clicking on a bubble later gives you options to edit the properties again. These topic bubbles, or 'Quirks' can be moved anywhere around the canvas, by dragging and dropping them. You can also create a bubble at a particular location by right clicking on some empty space.
It's also possible to group your themes, which is again a simple drag and drop. Just drop one bubble onto another, and it becomes a nested sub-category. For example you might have a category for Bread, and many different types as sub-categories, like Brown, Wholemeal, Rye, Sour-dough. You can even have sub-sub categories such as Bread -> Brown –> Seeded.
5. Code your data
Once you have some topic bubbles, you can code data to them by selecting some text, and dragging and dropping that selection onto the bubble. Every time you do this, you will see the bubble get a little bigger, and a colour coded highlight will appear around the section of text in the source. You can remove a piece of coded text by right clicking at any time on the highlighted stripe in the side column.
To see everything you've coded in a node, double click on the bubble, and all the results will be displayed across all sources. Clicking the Home button will take you back to the canvas view.
Now it's a process of going through and analysing your data, assigning sections of the text to themes as you go along. One piece of text can be assigned to any number of themes, and there is a keyword search function with synonyms that can help find comments on certain topics.
6. Explore your data
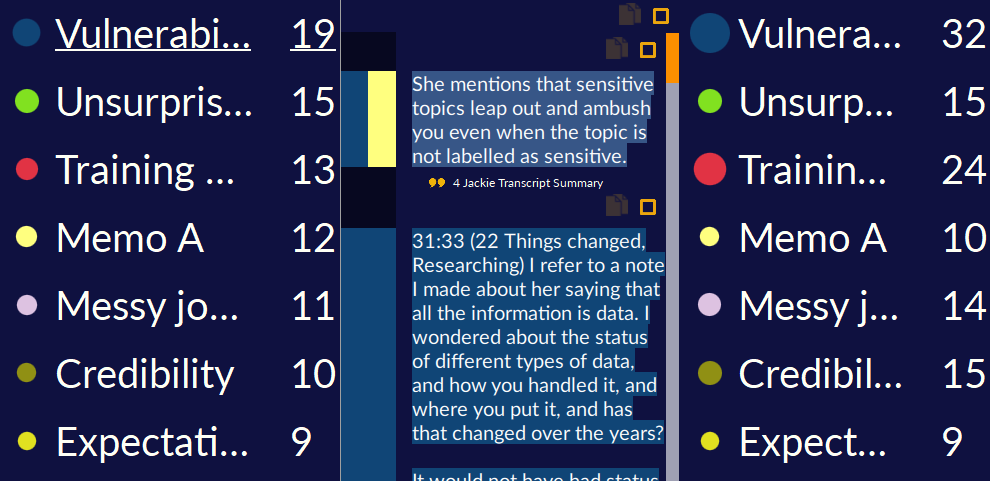
Once you have coded some or all of your sources, there are many tools in Quirkos that let you explore the data, looking for trends and surprises.
Using the Query view, you can run filtered searches to bring out coded data from particular kinds of sources, or work done by particular people during certain time periods.
Right clicking on any of the topic bubbles will allow you to show an 'overlap' view, which visualises connections between the themes based on how often they are coded together.
7. Export your coded data
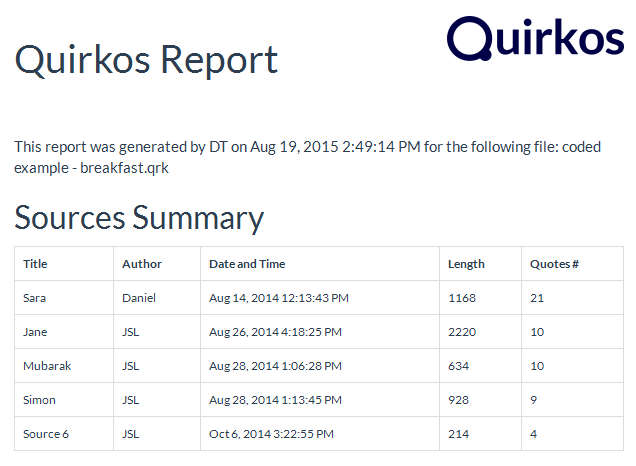
There are many different ways to export your data to explore further or share with others.
Generate a customisable report which shows summaries or all the detail of your project, with graphs and visual views.
Create a colour highlighted Word document which shows all your coding.
Export the data as a spreadsheet, to do statistical analysis in Excel or SPSS, and to bring into other software packages.
Try today!
Ready to give Quirkos a try? Register for a free 14-day trial of Quirkos today,
with no restrictions on features or
projects.with no restrictions on features or
projects.
Want to learn more? Read more about our features or see Quirkos in action!