Sharing qualitative research data from Quirkos
Once you’ve coded, explored and analysed your qualitative data, it’s time to share it with the world. For students, the first step will be supervisors, for researchers it might be peers or the wider research community

Once you’ve coded, explored and analysed your qualitative data, it’s time to share it with the world. For students, the first step will be supervisors, for researchers it might be peers or the wider research community, and for market research firms, it will be their clients. Regardless of who the end user of your research is, Quirkos offers a lot of different ways to get your hard earned coding out into the real world.
Share your project file
The best, and easiest way to share your coded data is to send your project file to someone. If they have a copy of Quirkos (even the trial) they will be able to explore the project in the same way you can, and you can work on it collaboratively. Files are compatible across Windows, Mac and Linux, and are small enough they can be e-mailed, put on a USB stick or Dropbox as needed.
Word export
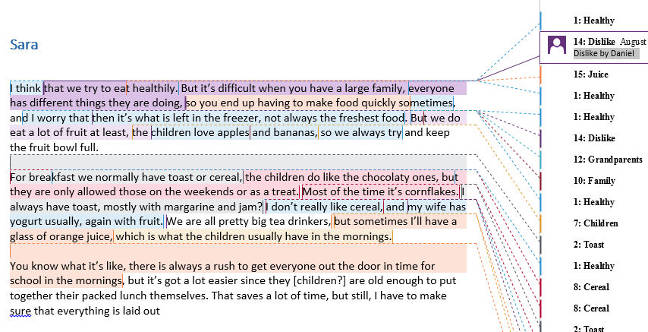
One of people’s favourite features is the Word export, which creates a standard Word file of your data, with comments and coloured highlights showing your complete coding. This means that pretty much anyone can see your coding, since the file will open in Microsoft Office, LibreOffice/OpenOffice, Google Docs, Pages (on Mac) and many others. It’s also a great way to print out your project if you prefer to read though it on paper, while still being able to see all your coding. If you print the ‘Full Markup’ view, you will still be able to see the name (and author) of the code on a black and white printer!

There are two options available in the ‘Project’ button – either ‘Export All Sources as Word Document’ which creates one long file, or ‘Export Each Source’ which creates a separate file for each source in the project in a folder you specify.
Reports
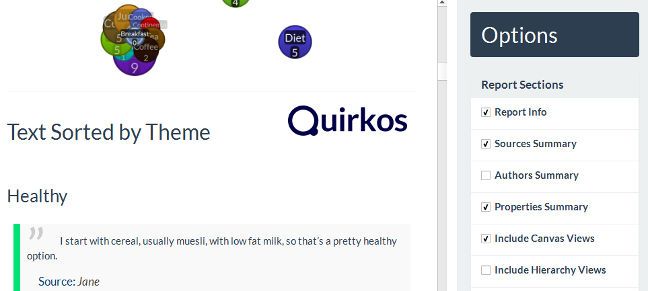
So this is the most conventional output in Quirkos, a customisable document which gives a summary of the project, and an ordered list of coded text segments. It also includes graphical views of your coding framework, including the clustered views which show the connections between themes. When generated in Quirkos, you will get a two columned preview, with a view of how the report will look on the left, and all the options for what you want to include in the report on the right.
You can print this directly, save it as a PDF document, or even save as a webpage. This last option creates a report folder that anyone can open, explore and customise in their browser, in the same way as you are able to in the Quirkos report view. This also creates a folder which contains all the images in the report (such as the canvas and overlap views) that you can then include directly in presentations or articles.

There are many options available here, including the ability to list all quotes by source (ie everything one person said) or by theme (ie everything everyone said on one topic). You can change how these quotes are formatted (by making the text or highlight into the colour of the Quirk) and the level of detail, such as whether to include the source name, properties and percentage of coding.
Sub-set reports (query view)
By default, the report button will generate output of the whole project. But if you want to just get responses from a sub-set of your data, you can generate reports containing only the results of filters from the query view. So you could generate a report that only shows the responses from Men or Women, or by one of the authors in the project.
CSV export
Quirkos also gives you the option to export your project as CSV files – a common spreadsheet format which you can open with in Excel, SPSS or equivalents. This allows you to do more quantitative analysis in statistical software, generate graphs of your coding, and conduct more detailed sub-analysis. The CSV export creates a series of files which represent the different tables in the project database, with v_highlight.csv containing your coded quotes. Other files contain the question and answers (in a structured project), a list of all your codes, levels, and source properties (also called metadata).
Database editing
For true power users, there is also the option to perform full SQL operations on your project file. Since Quirkos saves all your project data as a standard SQLite database, it’s possible to open and edit it with a number of third party tools such as SQL Browser to perform advanced operations. You can also use standard command line operations (CLI) like SELECT FROM WHERE to explore and edit the database. Our full manual has more details on the database structure. Hopefully, this will also allow for better integration with other qualitative analysis software in the future.
If you are interesting in seeing how Quirkos can help with coding and presenting your qualitative data, you can download a 14 day free trial and try for yourself. Good luck with your research!
